
The Hidden Costs of Road Salt
The Hidden Costs of Road Salt What you don’t know can hurt you. Everyone wants to be as safe as possible when...
By: Olivia Otsuka
Approximately 36 million Americans have at least one disability—over 19 million have a mobility impairment, over 10 million have a hearing impairment, and about 7 million have a visual impairment (6). Individuals with disabilities are entitled to the same experiences as able-bodied individuals (7). Thus, it is of the utmost importance that cartographers and graphic designers practice universal and barrier-free design when creating maps and graphics in order to prioritize accessibility (1). To effectively practice universal design, people with disabilities need to be involved in the planning and design process (6).
General Principles of Accessible Design
When creating maps and graphics for those with visual impairments, it is important to make adjustments to text, color, and written words in order to create more universally accessible designs. Using a larger font size helps make text easier to read (6). In addition to increasing font size, it is important to choose fonts that aren’t too elaborate (typically sans-serif and simple serif fonts) and maintain enough space between characters, words, and lines to maximize readability (2).
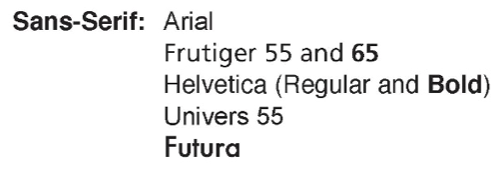
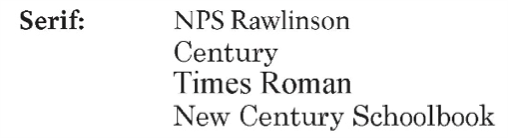
Examples of accessible fonts (2).
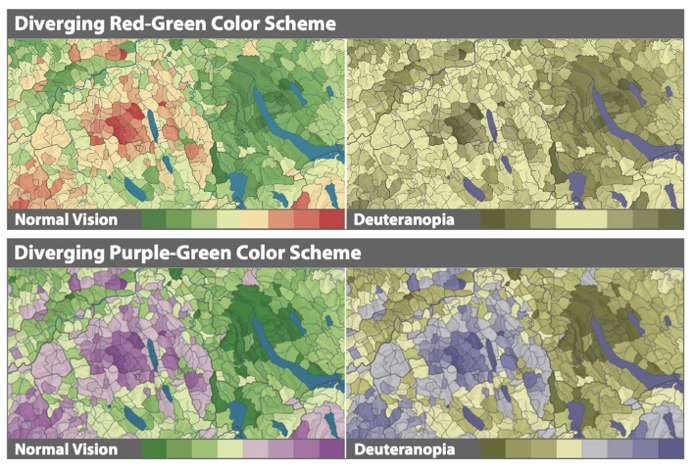
Like choosing accessible fonts, it is equally important to choose colors that are easily viewable by those with visual impairments (1). Red-green colorblindness is the most common form of color vision impairment, thus avoiding red-green color schemes in design is very important (1). Pivoting to a purple-green color scheme is one possible alternative to make color choice more accessible (1).
More generally, it is important to make contrast, brightness, and saturation strong to ensure that designs will be legible in environments with variable lighting (1). Relatedly, using contrasting background and text colors makes text more legible (2). There are a number of websites and resources that can be used to check the viewability of color schemes to ensure accessible design is practiced:
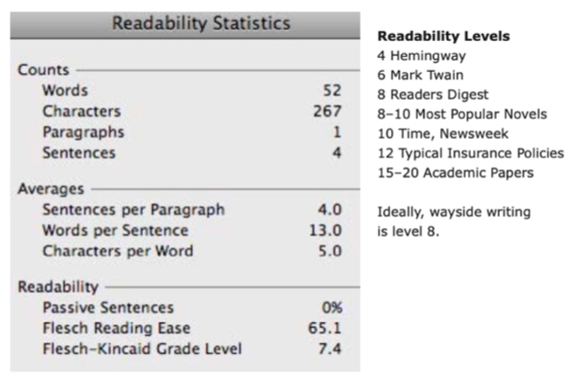
In order to make the written words themselves more universally accessible for maximum readability, it is important to organize the text into hierarchies of text blocks to focus the attention of readers (4). Generally, text should be kept concise with short paragraphs (2) and text should be balanced with images and graphics (3). Text should be written in plain English (4) and jargon should be avoided (3). The proofing tool on Microsoft Word can be used “to check the readability of draft text” as it reports a level-of-effort score—a score between 8-10 is ideal (4).
Accessible Map Design
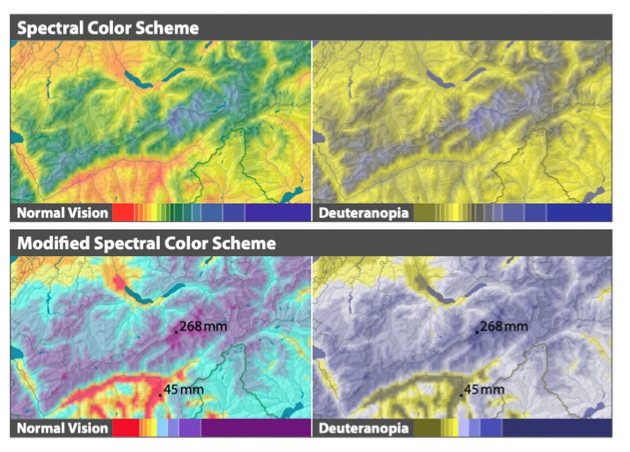
The most important principles to keep in mind when designing maps for those with visual impairments (in addition to the general principle listed above) are “(1) choosing unambiguous color combinations, (2) using alternative visual variables, and (3) directly annotating features” (1). To make color combinations more accessible, it is important to avoid red/green color combinations and make sure colors have a high contrast against each other, like in the modified spectral color scheme (1).
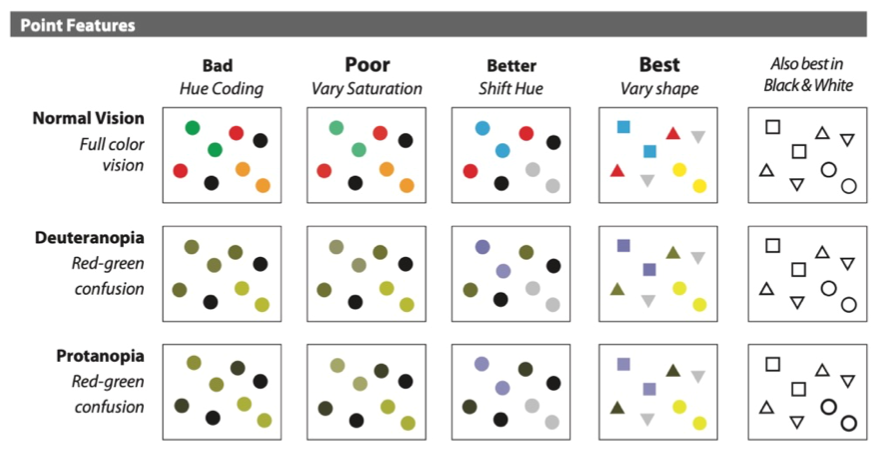
To increase the legibility of point features designers should use a variety of shapes and vary hue and saturation of the various symbols—the reader should easily be able to understand symbols without looking at the legend (1).
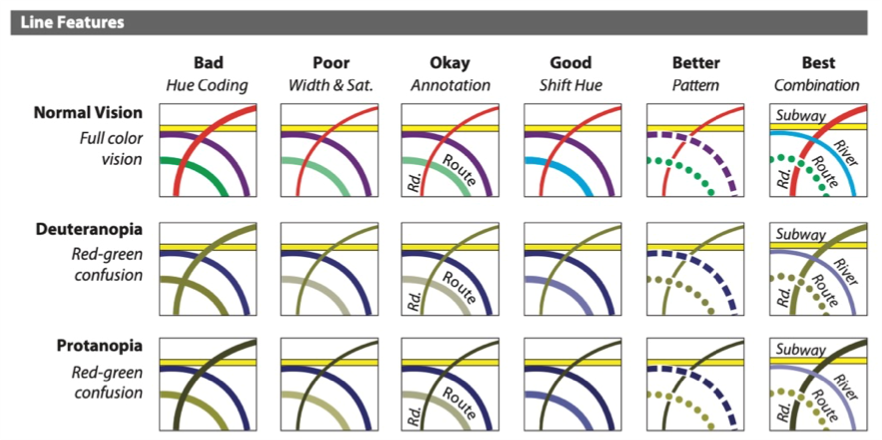
To increase the legibility of line features designers should use varying line patterns, shift hue and saturation, and use annotations (1).
Accessible Kiosks and Interpretive Wayside Signs
In order to ensure optimal physical accessibility of kiosks and interpretive wayside signs it is important to ensure that these structures are “located on smooth, level, and hard [surfaces] for easy mobility” (5). These structures also should be installed at heights and angles that can be viewed by all visitors and “offer clear, unrestricted views of park features referred to in the exhibits” (2).
Sources
1: https://cartographicperspectives.org/index.php/journal/article/view/cp58-jenny-kelso/pdf
2: https://www.nps.gov/subjects/hfc/upload/Master-Program-Guidelines-Interp-Media-V2-4_Michele-Hartley.docx
3: https://lewisandclark.org/grants/docs/NFS_Interpretive_Sign_Design_Steps.pdf
4: https://www.nps.gov/subjects/hfc/upload/Wayside-Guide-First-Edition.pdf
5: http://www.nrsrcaa.org/interp/manual/finalpdfs/Section8.PDF
6: https://www.fs.usda.gov/Internet/FSE_DOCUMENTS/stelprd3817041.pdf
7: https://www.nps.gov/subjects/hfc/index.htm
The Hidden Costs of Road Salt What you don’t know can hurt you. Everyone wants to be as safe as possible when...
What exactly is citizen science? The Eastern-Tailed Blue. One of the many species logged during the ATBI BioBlitz (Photo Credit: John...
Boreas Ponds Roads: How soil properties affect maintenance costs. What do soil properties have to do with road maintenance costs? A...
The Adirondacks is filled with different types of ground-nesting birds: nightjars, loons, bobolinks, robins, Wilson’s warblers, meadowlarks, harriers, and killdeer,...
What makes a good map? We make maps at Adirondack Research – and we research the best ways to make them....
The invaders of New York State Christopher Hart Did you know New York has one of the highest densities of invasive species...
By Maja Cannavo We have a new project in the works: a mountain bike map design! Here at Green Goat Maps, we’re creating...
At Adirondack Research, we have a tagline that explains almost all of the work we do. That tagline is “We...
At Adirondack Research we have an outstanding field crew that completes our on-the-ground research, collecting the data that allow us...

We sat down with Patrick Bly of Patrick Bly Photography to learn more about his upcoming photo project in partnership...