Invasive species are any kind of living organism that is not native to an ecosystem and causes some sort
of ecological, human health, or socio-economic harm. In 2022, Adirondack Research, a private research
and mapmaking firm, contracted with the New York State Department of Environmental Conservation
(NYSDEC) to survey portions of the Peconic River over a five-year period between 2022 and 2025. In
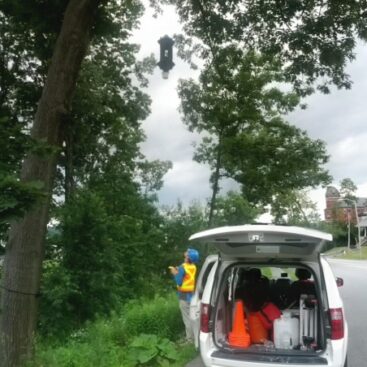
2022, the team surveyed nine sections of the Peconic River before and after ProcellaCOR EC herbicide
treatment of two target aquatic invasive plant species, floating primrose-willow (Ludwigia peploides)
and European frogbit (Hydrocharis morsus-ranae). The goal of this project is to monitor the effects of
this herbicide treatment on the target species as well as their non-target effects on the other native and
non-native plant species that occur in the waterway. In 2022, we surveyed the waterway in mid-July
prior to herbicide treatment, and then again in early September, six weeks after herbicide treatment.
We recorded plant abundance and plant damage during each survey. Data collected in the field was
used to produce individualized maps documenting aquatic plant distribution. In this report, we address
the results of this work in its first year of the five-year survey along with recommendations for
improvements that can be made over time to best address the goals of the NYSDEC.
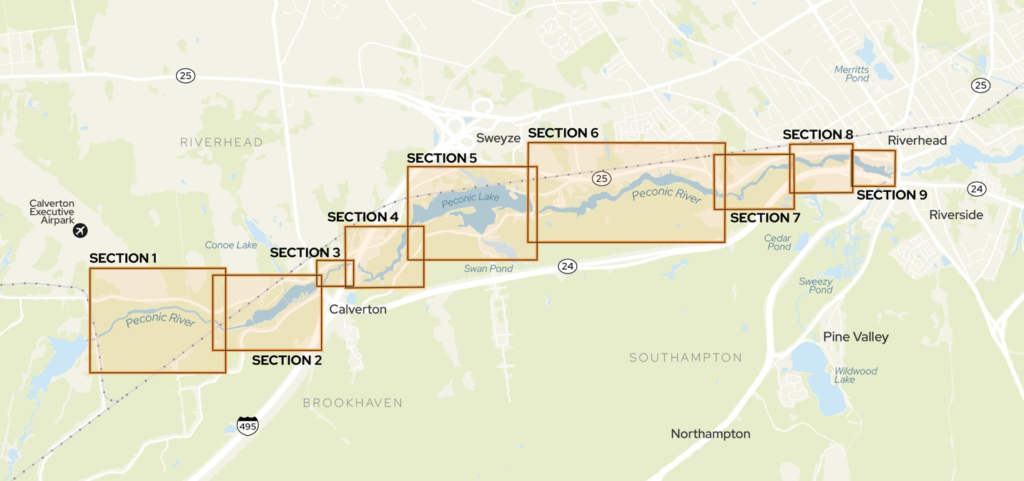
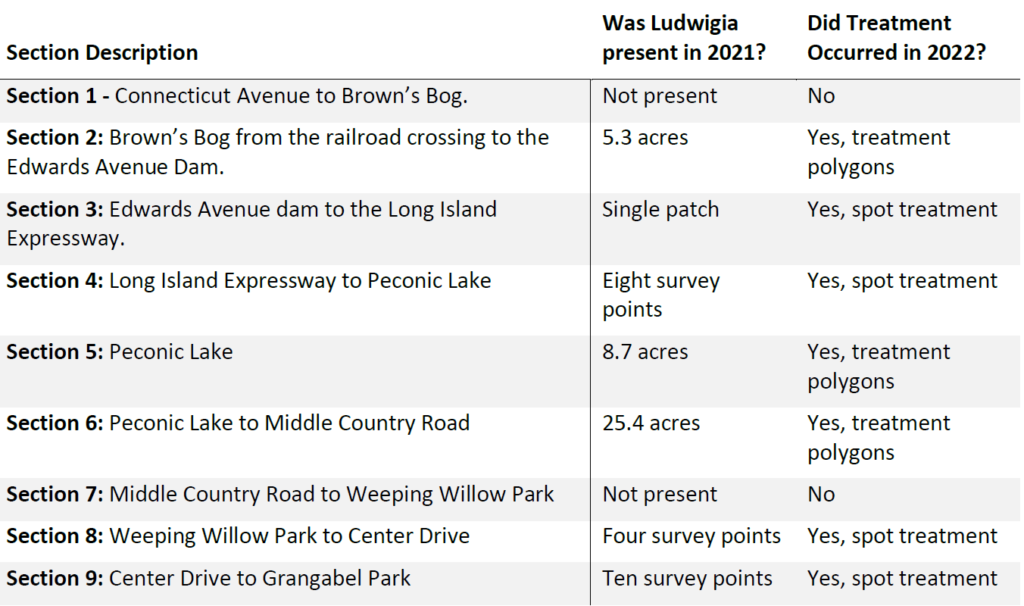
Survey Location Descriptions
Below is a table of each location surveyed in 2022 with information about each section’s location,
occurrence of Ludwigia in 2021, and treatment in 2022. Information on 2021 survey data were taken
directly from the 2021 Peconic Ludwigia peploides Control Project Five-year Management Plan
Methods for Plant Surveys and Data Collection
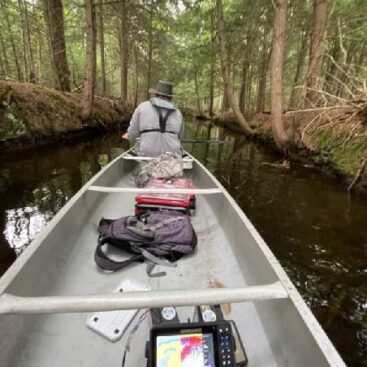
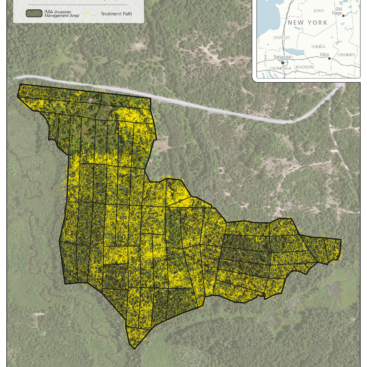
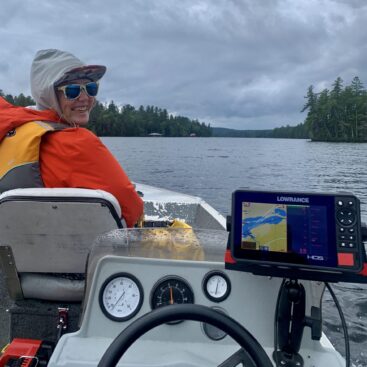
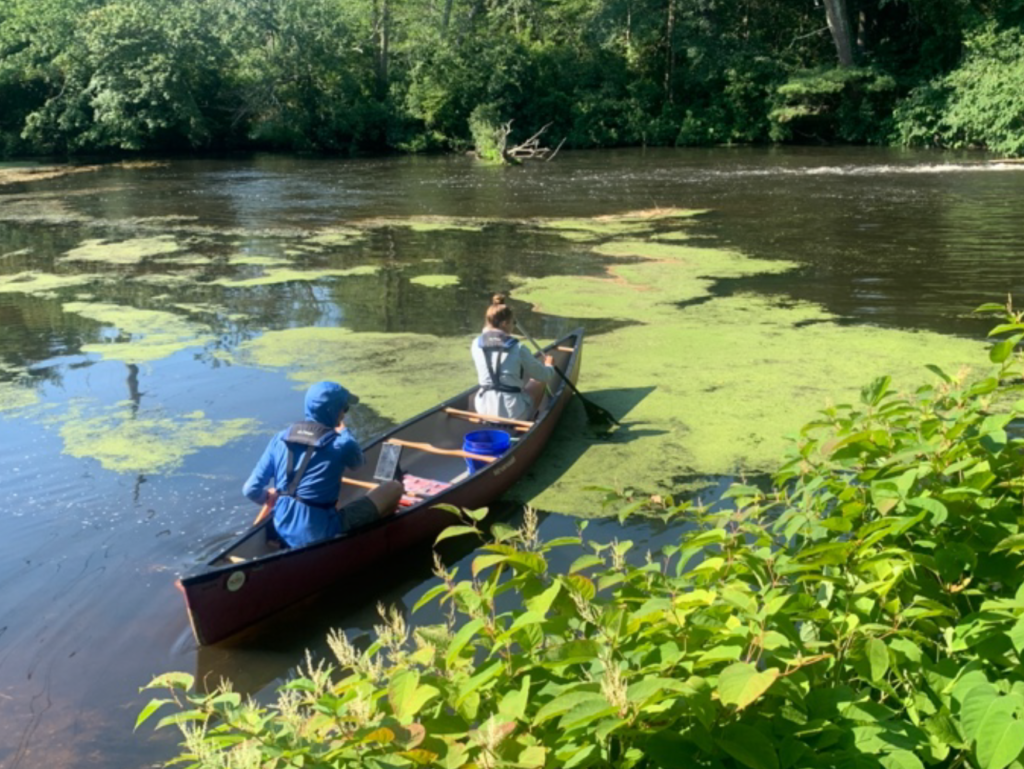
The team surveyed on a grid pattern of points that were established in 2021 at a scale of 10m x10m or
25m x 25m depending on level of detail needed to adequately monitor plant occurrence, density, and
health. Crew members navigated to each GPS point using data points from 2021 that we displayed in the
Esri Field Maps app. The crew also recorded polygons of beds of both Ludwigia and European frogbit to supplement point intercept data records, and to
help guide herbicide application.
We will first describe the point intercept methods employed, then we will describe the polygon surveys methodology. Pre-treatment surveys were scheduled to occur no more than one month prior to treatment, and post-treatment surveys were planned to be conducted six to eight weeks after treatment each year. In 2022, the post-treatment surveys were conducted six weeks after treatment. We utilized treatment polygons established during the 2021 SAV survey as a baseline for survey area.
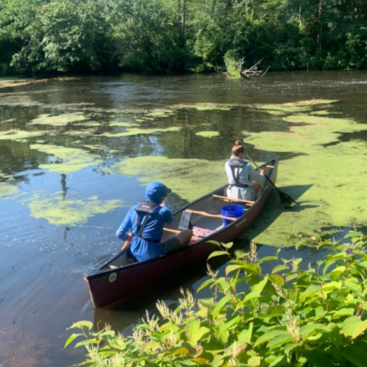
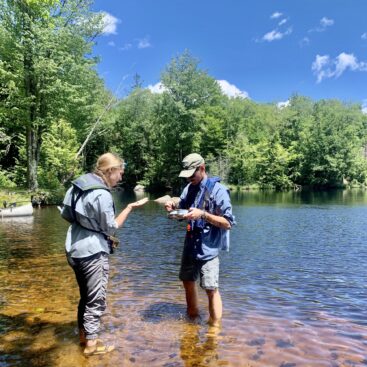
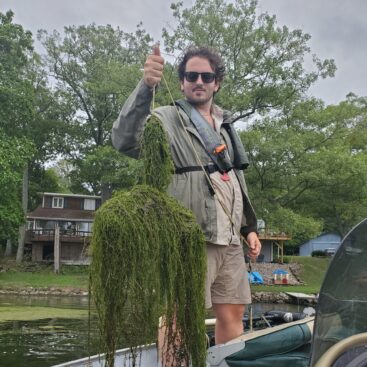
For the point intercept surveys, we sampled at approximately 300 survey stations across the nine river sections. At each point, a rake toss was conducted from each side of the boat and data were recorded in the Esri Survey123 app. Data collected included native and invasive plants observed as well as their respective percent cover class and plant health. Relative percent cover class range estimates of invasive plant species were taken using a rating system as follows: 0, <5, 6-25, 26-50, 51-75, and 76-100%. To save time, to simplify the data organizational structure for reporting, we combined the results of two independent rake toss samples (left side and right side of
boat) into a single sample at the time of survey. Specifically, we chose the higher of the two density classes for each plant species to report. This was an alternative to either creating an average of two categorical measurements (measurements will be described in the next section) or to utilizing a non-categorical measurement of plant density that could be used for averaging. This sampling and data collection method works well for this type of survey, and this method was discussed and approved prior to the survey. We also recorded a measurement of plant health,
described below.
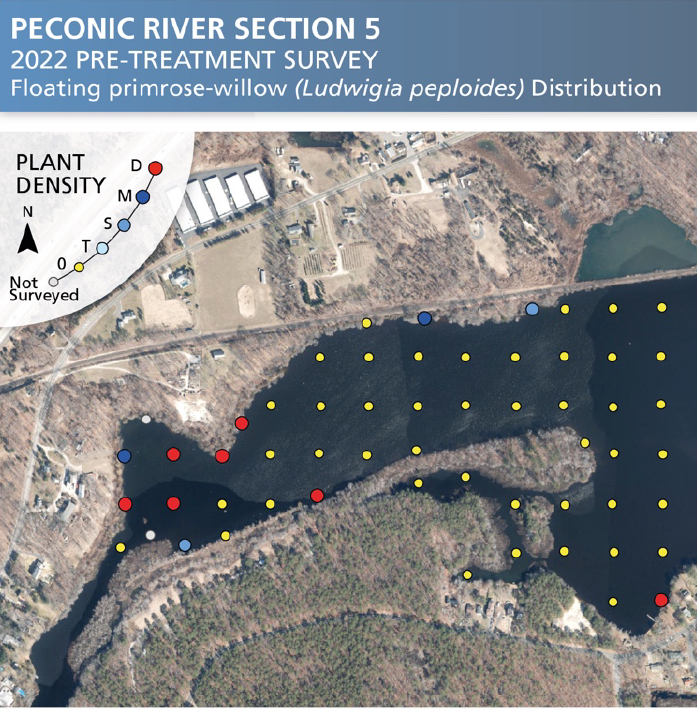
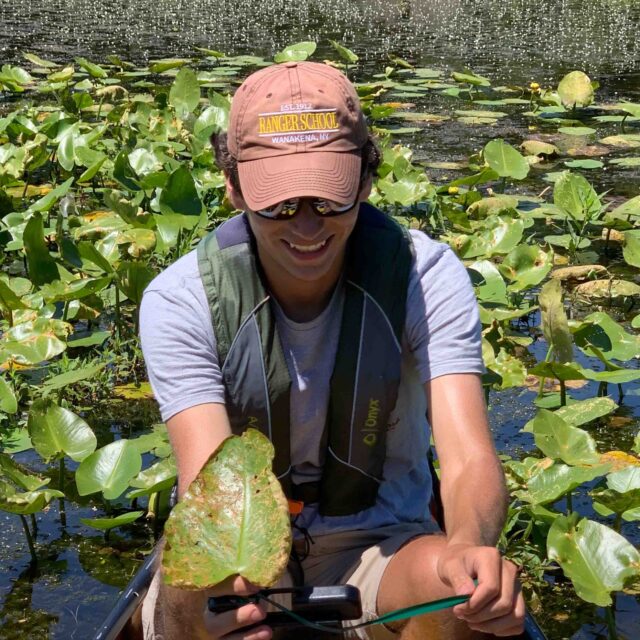
We conducted rake toss sampling by tossing a double-headed rake 10 feet from each side of the survey boat from the intersect points on the grid and pulled in toward the boat. If survey points were located in a dense and/or otherwise inaccessible AIS infestation, specifically Ludwigia peploides, a polygon was created and a note was taken to explain why we could not reach a specific sample station for rake toss sampling. In addition to recording polygons of beds of Ludwigia whose densities prohibited access to sample stations, we also delineated all areas of Ludwigia and European frogbit. We did not delineate beds of European frogbit in our July, 2022 pre-treatment survey, and were only able to delineate beds of Ludwigia during this survey. Specifically, we confirmed beds of Ludwigia that were delineated in 2021. We did delineate beds of both species during our post-treatment survey in September, 2022.
We recorded three metrics for plants across both point intercept survey data points and delineated polygons of Ludwigia and European frogbit beds. Those metrics included plant species identification, plant density, and a measurement of plant health on the two target species and on the non-target plants. We decided to use a simple four-class system for evaluating plant damage. These broad categories allowed us to efficiently measure plant damage while still documenting different levels of possible effects of herbicides on plant health. The table to the right described our damage classes. Not affected is normal in coloration as compared to pre-treatment surveys. Discoloration (1) is
recorded when any amount of browning is observed. This can be parts of a leaf, or an entire plant. Very Brown (2) is recorded when the plant is still recognizable, but is not looking like a healthy plant. Unrecognizable (3) is chosen when the plant is not able to be identified. Sometimes we can identify the plant based on healthy plants nearby even though we record the plant health as unrecognizable.
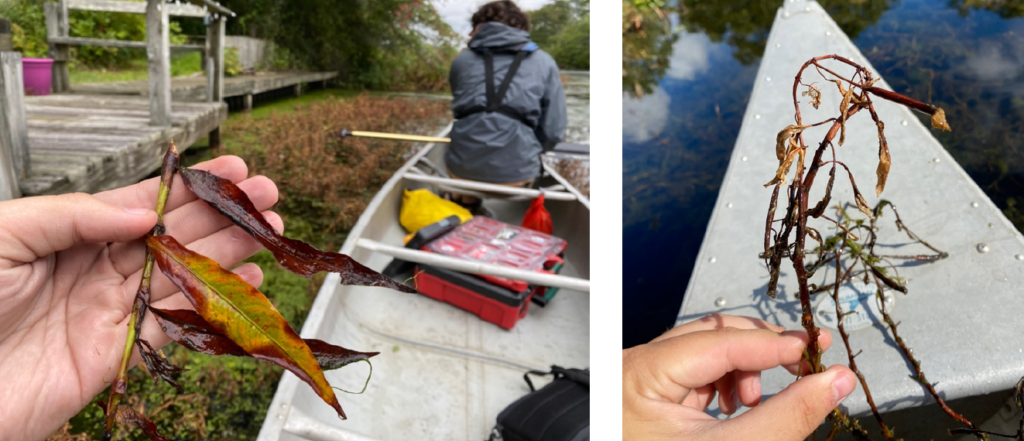
categorized as Unrecognizable (3).